
Assignment 1: Problems and Explorations with Graphing Functions and Relations
Dasha Adushkina
Assignment 1: Problems and Explorations with Graphing Functions and Relations
Dasha Adushkina
Examine the equation given below and see what happens when a part of the equation is changed. In this case, we are changing the number 4 on the left hand side of the equation.
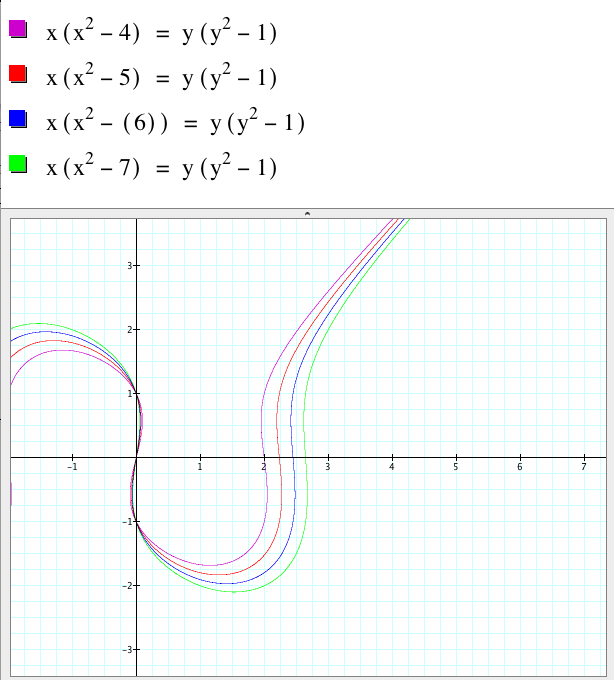
Notice how when the value increases from 4 to 5, to 6, and to 7, the graph holds the same shape, but shifts outward around (1.5, 2) and (-1.5, 2).
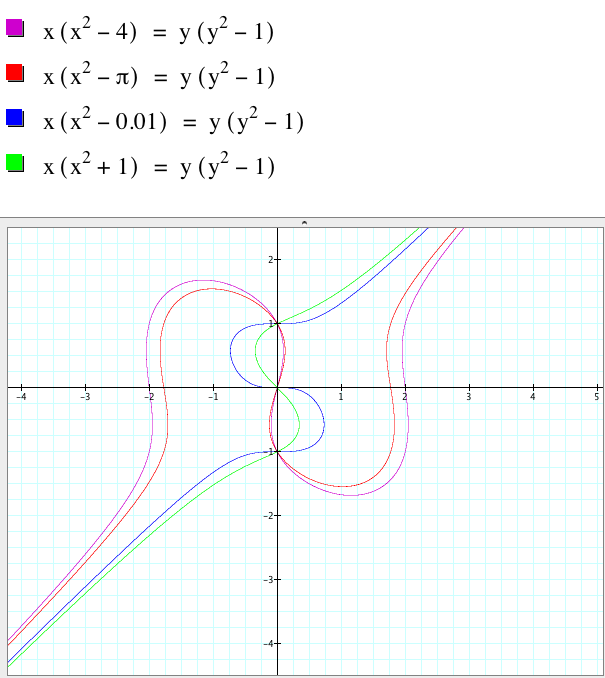
Now, notice the new graphs created by changing the 4 to pi, .01, and a -1.
Some conclusions that we can draw:
pi: creates a similar graph as to the original graph, since 3.14.. is very close to the original input 4.
.01: presents a more interesting case, since the graph, marked in blue, takes on a different shape. We can see that the S shape of the graph that is wound around the axis is much more compact. In fact, the conclusion we can draw from the graph of .01 is that it is a much more compact graph than of positive integers.
-1: Notice the similarities between the graph of .01 and -1 versus the similarity that -1 has with pi. The reason for this, as one might suspect, is the size of our number. Notice how when the input is a positive integer, the graph holds a similar shape as the graph produced by 4. When, on the other hand, the number is a small fraction or a negative number, the shape looks more as a mirror image of the previous graphs.
Now, let's observe the graphs in three dimensional space!